8 Critical Product Market Fit Questions to Ask in 2026

Product-market fit isn't a single metric you hit and forget; it's a continuous state of alignment between what you build and who you build it for. Achieving it separates high-growth companies from those that stall. But how do you know if you're there? The standard survey question, "How would you feel if you could no longer use our product?" is a well-known starting point, but relying on it alone leaves critical blind spots. True product-market fit is revealed through a much richer combination of user behavior, financial viability, and authentic customer evangelism.
This guide moves beyond that single data point. We present a comprehensive roundup of the eight diagnostic product market fit questions you must ask to measure, understand, and strengthen your position. For each question, we break down not just what to ask, but how to interpret the answers through a mix of qualitative feedback and quantitative data. You'll get specific phrasing for customer interviews, survey design tips, and a clear look at the internal metrics that tell the real story.
We'll also explore practical, actionable ways to capture and analyze these insights. We'll show you how to use tools like FeatureBot to turn qualitative answers into a data-driven product strategy, clustering feedback, weighting it by MRR, and automating the follow-up process. Forget vague feelings and abstract theories. This is your playbook for asking the right product market fit questions and turning those answers into a durable, defensible advantage. Let's get started.
1. Are Your Users Actively Requesting Your Core Features?
This diagnostic question flips the script on product development. Instead of asking if users like the features you've built, it asks if they were demanding them before you built them. It measures the pull from the market by analyzing unsolicited feature requests and feedback, providing a powerful signal for product-market fit. When users independently identify a problem and request a solution that aligns with your core value proposition, you’ve struck a nerve.
For a tool like FeatureBot, this isn't just theory; it's the entire premise. The platform was designed to capture this exact signal. For example, if your users are consistently asking for feedback management tools, AI-powered clustering of their own customer requests, or revenue-weighted prioritization, it validates that these core features solve urgent, expensive problems for them.
Real-World Examples
- Slack: The platform’s robust ecosystem of integrations wasn't just a smart idea; it was a direct response to a constant stream of user requests to connect their other workplace tools. This demand-driven approach made Slack an indispensable hub for communication.
- Notion: Before Notion offered a gallery of official database templates, power users were already trying to build their own and repeatedly asking for more structured solutions. This clear demand signaled a massive opportunity, which Notion capitalized on.
Actionable Playbook for Capturing Demand
To effectively answer this crucial product-market fit question, you need a systematic way to listen. Vague feedback is inactionable; specific, repeated requests are a goldmine.
- Centralize and Cluster: Use a tool to automatically group similar requests from different channels (email, support tickets, Slack). FeatureBot's AI clustering can identify themes even when users use different phrasing or languages, revealing the true volume of demand for a specific feature.
- Weight by Revenue: A feature requested by ten free-plan users is different from a feature requested by ten enterprise customers. Weighting requests by Monthly Recurring Revenue (MRR) helps distinguish high-value signals from noise, focusing your roadmap on what your best customers need.
- Track Request Velocity: Is the number of requests for a specific feature increasing over time? A rising velocity indicates a growing, organic need in your target market. Monitor this trend weekly to spot opportunities before competitors do.
2. Do Users Show Strong Retention and Low Churn for Your Solution?
This diagnostic question shifts focus from initial adoption to sustained engagement, measuring whether users find long-term value in your product. High retention and low churn are among the most reliable indicators of product-market fit because they prove your solution has become an indispensable part of your users' workflow. When users stick around month after month, they are implicitly voting that your product solves an ongoing, important problem for them.
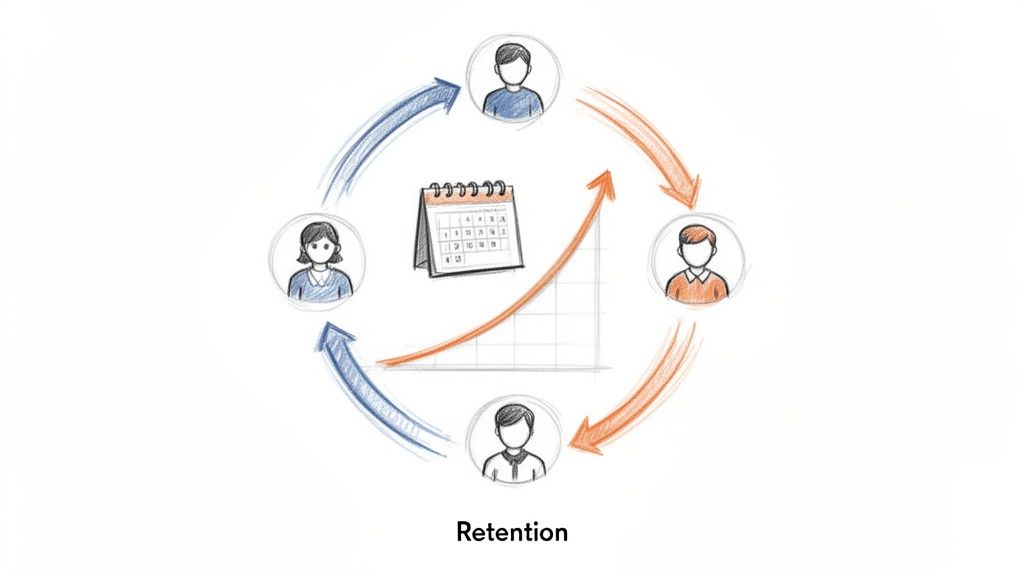
For a platform like FeatureBot, this metric is paramount. The tool's value compounds over time; teams that consistently capture, cluster, and act on user feedback see tangible improvements in their roadmap decisions and customer satisfaction. A product team that actively uses their feedback dashboards week after week is demonstrating that the insights generated are critical to their success.
Real-World Examples
- Superhuman: Famously, Superhuman didn't scale until it achieved strong weekly retention metrics, proving that its core user base was deeply engaged. This retention-first approach set a new standard for validating product-market fit before pouring fuel on growth.
- Slack: The platform's legendary day-one retention of over 30% was an early signal of its incredible stickiness. Strong long-term retention confirmed that once teams adopted Slack, they couldn't imagine working without it.
Actionable Playbook for Measuring Stickiness
To accurately gauge retention as one of your core product market fit questions, you need to go beyond surface-level numbers. A robust retention analysis reveals why users stay and where the value lies. For more detail, explore these customer retention best practices.
- Track Retention by Cohort: Analyze retention curves for different user groups based on when they signed up. This isolates the impact of product improvements or marketing campaigns from seasonal trends, giving you a clearer picture of whether your product is getting stickier over time.
- Correlate Retention with Feature Usage: Use analytics to identify which features are most used by your highly retained cohorts. FeatureBot, for example, can correlate high retention with teams that regularly use AI clustering and close the loop with users on shipped features. This identifies your "sticky" capabilities.
- Measure Time-to-First-Value: How quickly do new users experience the core benefit of your product? For FeatureBot users on the Free plan, those who capture their first piece of feedback within 24 hours show significantly higher long-term retention. Shortening this "aha!" moment is critical.
- Segment Retention by Customer MRR: Not all churn is equal. High-value customers staying longer is a powerful signal of strong product-market fit in your ideal customer profile. Prioritize the feedback from these cohorts to protect and grow your most valuable revenue streams.
3. Are Users Willing to Pay for Your Solution?
This is the ultimate acid test for product-market fit. While free sign-ups measure interest, actual payment measures commitment and perceived value. This question cuts through vanity metrics to determine if you have created something people find indispensable enough to exchange money for. It validates that you are solving a problem that is not just a nuisance but an expensive, urgent pain point.
For a product like FeatureBot, this signal is critical. When a user on the Free plan upgrades to a Pro or Enterprise tier because they've hit a feedback volume threshold or need revenue-weighting, it confirms the core value proposition. They aren't just trying a tool; they are investing in a solution because the cost of not having it has become too high.

Real-World Examples
- Figma: The company’s generous free tier allowed for widespread adoption, but its rapid conversion rate to paid plans for team-based features was a powerful, early signal of product-market fit in a professional context.
- Notion: While it grew for years on word-of-mouth with a strong free offering, the introduction and adoption of paid team-based plans proved it could transition from a beloved personal tool to an essential business platform.
- FeatureBot: Users on the free plan consistently upgrade when their feedback volume grows. This behavior validates a strong fit within product-led growth teams that are scaling their customer listening operations.
Actionable Playbook for Measuring Willingness to Pay
Answering this product-market fit question requires more than just looking at revenue. You need to understand the why behind the purchase to build a repeatable growth engine.
- Track Conversion Triggers: Identify the exact moment or feature usage that prompts a free user to upgrade. For FeatureBot, this is often when a team hits the limit for tracked feedback or needs to connect more data sources. Knowing this allows you to guide free users toward that high-value "aha" moment faster.
- Segment by Pricing Tier: Implement multiple pricing plans (e.g., Free, Pro, Enterprise) to capture different market segments. Analyze which features are most used by each paid tier to understand what different personas value most. This insight is crucial for roadmap planning and future monetization strategies.
- Gather Pricing Feedback Directly: Use your own product to understand price sensitivity. With FeatureBot, you can create a dedicated feedback board for prospects or current users to comment on pricing, feature packaging, and what they’d be willing to pay for. This closes the loop between what you build and what the market will bear.
4. Do Users Recommend Your Product to Others (Net Promoter Score & Viral Loop)?
This diagnostic question measures the ultimate sign of user value: organic advocacy. It moves beyond simple satisfaction to gauge whether your product is so good that users willingly put their own reputation on the line to recommend it. Tracking metrics like Net Promoter Score (NPS), referral rates, and viral loops provides a quantifiable signal of word-of-mouth strength, a cornerstone of sustainable product-led growth.
For a product like FeatureBot, this isn’t just a vanity metric; it’s a core growth engine. When a product manager at one company recommends FeatureBot to a peer at another, it validates that the tool provides a clear, demonstrable ROI. This natural evangelism, driven by solving a deep-seated pain point, is one of the most powerful indicators of product-market fit.
Real-World Examples
- Dropbox: The company famously achieved explosive growth through its dual-sided referral program. By rewarding users with extra storage for inviting friends, Dropbox created a powerful viral loop that proved its core utility was compelling enough to share.
- Slack: With an NPS score consistently above 50, Slack's growth was fueled by user evangelism. Teams would adopt it, love the experience, and then champion its adoption in their next company, creating an unstoppable organic expansion.
Actionable Playbook for Measuring Advocacy
To accurately answer this vital product-market fit question, you must move from anecdotal evidence to a systematic measurement of user advocacy. Unlocking this data reveals your most enthusiastic champions and your biggest growth opportunities.
- Segment NPS by Feature Usage: Don't just look at your overall NPS. Use a tool like FeatureBot to correlate NPS scores with specific feature adoption. This can reveal which capabilities generate the strongest advocacy, helping you double down on what truly creates "promoters."
- Track Referral Sources: Identify which user segments and channels drive the highest-value acquired customers. This data helps you focus your efforts on nurturing the user profiles most likely to become evangelists and attract more like them.
- Build Virality In: Engineer opportunities for organic sharing directly into your product. For example, FeatureBot’s shareable feedback portal links and roadmap updates are designed to be referenced in internal team discussions, naturally driving peer discovery and adoption from within a customer’s own network.
5. Is Your Customer Acquisition Cost (CAC) Sustainable Relative to Lifetime Value (LTV)?
This critical diagnostic question moves beyond user sentiment to evaluate the raw financial health of your business model. It forces you to ask if your growth engine is profitable by comparing the total cost to acquire a customer (CAC) against the revenue they generate over their lifetime (LTV). A healthy LTV to CAC ratio, typically cited as 3:1 or better, is one of the strongest indicators of product-market fit, proving your go-to-market strategy is economically viable and scalable.
For a tool like FeatureBot, this means meticulously tracking the efficiency of marketing and sales channels against customer retention and expansion revenue. If your product-led growth motion, driven by a valuable Free plan, results in a low CAC and high LTV, you’ve built a sustainable business. It validates that the value you deliver keeps customers around long enough to more than pay for what it cost to win them.
Real-World Examples
- Slack: By leveraging a powerful word-of-mouth loop and a product-led growth model, Slack achieved an exceptional LTV:CAC ratio early on, often exceeding 5:1. This financial proof point signaled a deep market resonance and a sustainable path to dominance.
- Notion: Notion’s viral, community-driven growth created a word-of-mouth engine so powerful that its CAC approached zero in many segments. When users become your primary acquisition channel, you have undeniable evidence of strong product-market fit.
Actionable Playbook for Capturing Demand
Answering this product-market fit question requires a rigorous approach to unit economics. You must connect your acquisition spending directly to customer value and behavior.
- Calculate CAC by Channel: Don't blend all your acquisition costs. Isolate the CAC for paid ads, content marketing, organic search, and referrals. This reveals which channels attract your most profitable users. When users actively recommend your product, it's a strong sign of viral potential, and understanding the benefits of referral programs can further accelerate this organic growth.
- Segment by Revenue and LTV: Use a tool like FeatureBot to segment your customer base by LTV. By analyzing the feature requests and feedback from your highest-LTV cohorts, you can prioritize roadmap items that directly contribute to retention and expansion, reinforcing the financial health of your model. Learn more about strategies for increasing customer lifetime value.
- Track Your CAC Payback Period: How many months does it take for a new customer to generate enough gross margin to cover their acquisition cost? A strong product-market fit shortens this window, ideally to under 12 months. A shorter payback period means you can reinvest capital into growth much faster.
6. Are Users Solving Their Core Problem in Your Product? (Job-to-be-Done Fit)
This diagnostic question moves beyond feature usage to measure outcome achievement. Rooted in Clayton Christensen's Jobs-to-be-Done (JTBD) theory, it asks whether your product effectively helps users accomplish the specific job they "hired" it to do. It evaluates functional, emotional, and social job completion, providing one of the most accurate signals for product-market fit. People don’t buy products; they hire them to make progress in their lives.

For a tool like FeatureBot, this means verifying that teams are truly solving their core job: prioritizing features by actual user value instead of guessing. Do they successfully use the platform to understand user feedback, prioritize features by revenue impact, and close the feedback loop? If they complete this job, they achieve progress and are more likely to become long-term, loyal customers.
Real-World Examples
- Figma: Before Figma, the job of "collaborative design without installation friction" for distributed teams was painful. Figma solved this job so effectively that it became the industry standard, replacing desktop-native tools.
- Slack: The core job Slack solved was "frictionless team communication and coordination," which email and IRC handled poorly. By solving this job better than any alternative, it became indispensable for modern teams.
Actionable Playbook for Measuring Job Completion
To understand if users are successfully completing their job, you need both qualitative and quantitative evidence. This requires a focused, outcome-driven approach to product analytics and user research.
- Conduct Job-Focused Interviews: Move beyond feature feedback. Ask users, "Walk me through the last time you used our product to [achieve core outcome]." Then ask, "Did you accomplish what you set out to do?" This uncovers the real-world context and success criteria for their job.
- Measure Time-to-Job-Completion: Use analytics to track how long it takes a new user to achieve their primary goal. For FeatureBot, this could be the time from signing up to their first revenue-weighted prioritization decision. Shorter paths to completing the core job indicate a stronger fit and a better user experience.
- Create Outcome-Driven Metrics: Align your success metrics with the user's job. Instead of tracking "features used," track "features shipped based on FeatureBot insights" or "feedback loops closed per week." This ties your product's success directly to your customer's progress. You can explore more JTBD concepts in our guide to product management frameworks.
7. Do You Have Clear Product Differentiation from Competitors?
This question forces you to move beyond feature parity and assess whether your product offers a unique, defensible advantage. Strong differentiation is a powerful indicator of product-market fit because it proves you aren’t just competing; you are owning a specific niche or solving a problem in a way that others can't easily replicate. It answers the critical "why you?" question from the customer's perspective.
For FeatureBot, this isn’t about being just another feedback tool. It’s about confirming that customers actively choose it for its specific, hard-to-copy differentiators. These include AI-powered semantic clustering that understands user intent, revenue-weighted prioritization that ties feedback to business impact, and a conversational widget that engages users more effectively than static forms. These aren't just features; they are a distinct strategic approach.
Real-World Examples
- Figma: While installed design tools like Sketch and Adobe XD dominated, Figma differentiated with its browser-based, real-time collaboration. This unique value proposition made it indispensable for distributed teams, allowing it to displace entrenched competitors.
- Slack: Before Slack, tools like IRC and HipChat existed for team communication. Slack differentiated itself through a vastly superior user experience and seamless integrations, creating a central hub for workplace tools that was fundamentally more valuable.
Actionable Playbook for Measuring Differentiation
To uncover whether your differentiation is truly resonating, you need to systematically collect and analyze competitive intelligence directly from your market.
- Conduct Win/Loss Interviews: When you win a new customer, ask them directly: "Why did you choose us over [Competitor X]?" When you lose a deal, ask the prospect the same question. These conversations provide unfiltered insights into your perceived value.
- Gather Competitive Feedback: Use a tool like FeatureBot to track mentions of competitors in user feedback. Create a dedicated feedback tag for each competitor to monitor how often they come up and in what context, revealing which of your features are driving decisions.
- Test Value with Pricing: True differentiation allows you to command a higher price. Customers will pay more for unique value they can't get elsewhere. Run pricing experiments to see if the market values your unique features enough to pay a premium for them.
- Focus on Hard-to-Copy Advantages: Build your differentiation around moats like proprietary technology (like FeatureBot's AI clustering), network effects, or unique data insights. A slick UI can be copied, but a deep technological advantage is far more defensible.
8. Are You Reaching and Resonating with the Right Target Market Segment?
This diagnostic question, popularized by frameworks like Geoffrey Moore's Crossing the Chasm, asks whether you have identified and successfully penetrated a specific customer segment where your product delivers exceptional value. Product-market fit is rarely a broad phenomenon; it typically ignites within a narrow "beachhead" market first. Validating that you've found and are winning this initial group is a powerful indicator of a sustainable, scalable business.
For a tool like FeatureBot, this means confirming that a specific archetype, such as product-led SaaS founders, experiences significantly stronger satisfaction, retention, and advocacy than other potential segments like large enterprises or non-tech companies. If one segment is thriving while others are churning, you haven't failed; you've discovered where your true fit lies.
Real-World Examples
- Slack: Initially, Slack found its most fervent user base within small, agile tech teams and startups. They dominated this beachhead market, leveraging its inherent virality before successfully expanding into larger enterprise accounts.
- Notion: The platform first gained a cult-like following among students and individual creators who valued its flexibility. This passionate user base became a powerful engine for growth, eventually pulling Notion into productivity-focused teams and companies. A crucial aspect of product-market fit is successfully reaching and resonating with your target market. Examining a case study on Fitlife's expanded market reach can offer insights into achieving this.
Actionable Playbook for Defining Your Beachhead
To find your true believers, you must move beyond vanity metrics and segment your user data to find the pockets of undeniable success. Answering this product market fit question requires a focused, data-driven approach.
- Identify Your Highest-Value Segment: Use a tool to analyze your user base by role, company size, and industry. In FeatureBot, you can create segments to track which customer archetypes have the highest retention, NPS scores, and engagement rates. This isn't a guess; it's a data-backed conclusion about who loves your product most.
- Focus All Efforts on the Beachhead: Once identified, concentrate your sales, marketing, and product efforts exclusively on this segment until you achieve deep penetration (e.g., 50%+ awareness). Extract their specific language and use cases for your messaging to ensure you resonate deeply.
- Track Segment-Specific Feedback: Use segmentation within your feedback management system to isolate the feature requests and pain points coming from your beachhead customers. Their needs should dictate your near-term roadmap, as solving their problems will solidify your fit and fuel your expansion strategy.
8-Point Product-Market Fit Comparison
| Diagnostic | Implementation Complexity 🔄 | Resource Requirements ⚡ | Expected Outcomes 📊 | Ideal Use Cases 💡 | Key Advantages ⭐ |
|---|---|---|---|---|---|
| Are Your Users Actively Requesting Your Core Features? | Low–Medium: instrument feedback capture and clustering. | Low: uses existing unsolicited feedback; needs volume for significance. | Validates demand; % of roadmap driven by organic requests. | Early PMF validation; feature prioritization. | Direct, cost‑effective signal of product‑market fit. |
| Do Users Show Strong Retention and Low Churn for Your Solution? | Medium: cohort and time‑series analytics required. | Medium–High: needs 6–12 months of usage data and tracking. | Demonstrates sustained value; impacts LTV and unit economics. | SaaS scaling; assessing long‑term adoption. | Most reliable indicator of durable PMF. |
| Are Users Willing to Pay for Your Solution? | Medium: pricing experiments and conversion funnels. | Medium: payment infra, experiments, and tracking. | Confirms monetization and revenue potential; conversion rates. | Monetization strategy; pricing validation. | Definitive proof of value; enables revenue‑driven prioritization. |
| Do Users Recommend Your Product to Others (NPS & Viral Loop)? | Low–Medium: regular surveys and referral tracking. | Low–Medium: survey tooling and referral attribution. | Measures advocacy and organic growth potential. | Product‑led growth; referral and viral acquisition. | Low‑cost growth; builds social proof and credibility. |
| Is Your CAC Sustainable Relative to LTV? | Medium–High: financial attribution and channel analysis. | High: finance, analytics, and channel tracking required. | Reveals profitability and scalable growth potential (CAC:LTV). | Scaling, investment readiness, GTM optimization. | Ensures profitable growth; guides marketing spend. |
| Are Users Solving Their Core Problem in Your Product? (Job‑to‑be‑Done Fit) | High: deep qualitative research and outcome measurement. | High: user interviews, research resources, scenario validation. | Confirms core job completion; reduces feature bloat. | Product strategy; roadmap decisions and differentiation. | Deepest level of PMF insight; drives defensible product choices. |
| Do You Have Clear Product Differentiation from Competitors? | Medium: competitor analysis and defensibility testing. | Medium: research, product development to sustain gaps. | Ability to command premium and reduce churn. | Positioning, premium pricing, niche leadership. | Creates pricing power and a defensible moat. |
| Are You Reaching and Resonating with the Right Target Market Segment? | Medium: segmentation, cohort and penetration analysis. | Medium: analytics, GTM focus, and targeted outreach. | Higher retention/NPS within beachhead; efficient growth. | Early GTM; finding and dominating a beachhead market. | Focuses resources; enables rapid, repeatable adoption. |
From Questions to Conviction: Your Next Steps
You now have a comprehensive arsenal of product market fit questions designed to cut through the noise and get to the heart of what your customers truly value. We’ve moved beyond the abstract theory, providing you with specific, actionable queries for every stage of the user journey, from initial interviews to churn analysis. The goal is no longer to simply feel like you have product-market fit; it's to build a quantifiable, data-backed conviction.
This journey from ambiguity to clarity is not a one-time event. It’s a continuous process of inquiry, analysis, and action. Each question we explored, from feature requests and retention metrics to willingness to pay and competitive differentiation, serves as a vital signal. Answering them isn't about checking a box; it's about building a living, breathing understanding of your market that evolves as your product and customer base grow.
The Power of a Systematic Approach
The true competitive advantage lies not in asking these questions once, but in building a system to ask them repeatedly. Your product roadmap, marketing strategy, and go-to-market motions should be directly informed by the answers you gather. This is where a dedicated feedback infrastructure becomes indispensable.
- Centralize Everything: Instead of letting valuable insights languish in Slack threads, support tickets, and individual interview notes, centralize them into a single source of truth.
- Weight by Impact: Not all feedback is created equal. A feature request from a high-MRR enterprise customer carries more immediate weight than one from a free user. Your system should allow you to segment and prioritize accordingly.
- Close the Loop: The most powerful way to build loyalty is to show users you're listening. When you ship a feature they asked for, a system that automates follow-ups and notifications turns a simple update into a moment of customer delight.
This systematic approach transforms feedback from a chaotic stream of data into a strategic asset. It ensures that the most critical product market fit questions are not just asked, but are consistently answered with fresh, relevant data directly from the people who matter most: your users. This is the engine that drives sustainable, user-centric growth.
Turning Insight into Action
The framework laid out in this article provides the "what" and "why," but the "how" is equally critical. You need tools that make this process seamless, integrating directly into your existing workflows without adding friction for your team or your customers. The ultimate goal is to create a tight feedback loop where user insights are captured, analyzed, and acted upon with speed and precision.
By embedding this process into your company's DNA, you stop guessing and start knowing. You build a culture of deep customer empathy, where every decision is anchored in a clear understanding of the user's core problem and their perception of your solution. This is how you move from simply having a product to building a business with undeniable, durable product-market fit.
Ready to turn these product market fit questions into a systematic growth engine? FeatureBot helps you capture, centralize, and act on user feedback without leaving your existing tools. We don't offer a free trial, but our Free plan is the perfect way to get started and see how our conversational widget can help you capture the qualitative data you need.
Ready to capture better feedback?
FeatureBot helps you collect, organize, and prioritize user feedback with AI-powered conversations.
Get Started Free